2 | Getting the data
data2013 <- read.xlsx2("data/UN_MigrantStockByOriginAndDestination_2013.xls",
                       sheetName = "Table 10",
                       startRow = 16, colIndex = c(2, 4 , 10:241),
                       colClasses = c("character", rep("numeric", 232)))
wmap <- readShapeSpatial("data/110m_cultural/ne_110m_admin_0_countries.shp")
places <- read.csv("data/cities1000.csv", header=FALSE, stringsAsFactors=FALSE)
3 | Data processing
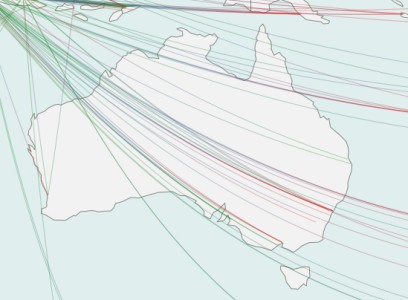
- With some processing, a data-frame with the required arc connections is created. Following is an example a section of the dataframe for Australia
##   source destination stock lat.d lon.d lat.s lon.s stocklog id
## 1     AD          AU    22   -27   133  42.5   1.5        3  1
## 2     AD          AU    22   -27   133  42.5   1.5        3  1
## 3     AD          AU    22   -27   133  42.5   1.5        3  1
## 4     AE          AU  5890   -27   133  24.0  54.0        9  2
## 5     AE          AU  5890   -27   133  24.0  54.0        9  2
## 6     AE          AU  5890   -27   133  24.0  54.0        9  2
## 7     AE          AU  5890   -27   133  24.0  54.0        9  2
## 8     AE          AU  5890   -27   133  24.0  54.0        9  2
- In the next step, the source and destination coordinates are replaced with locations of cities from the country or region.
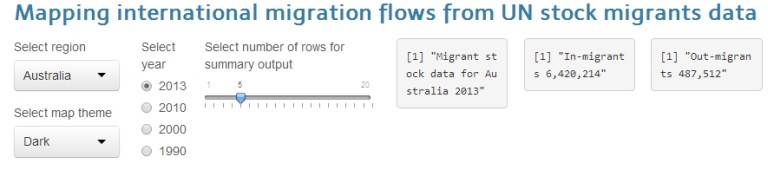 Screenshot of options